2026-03-07
See What Your Periphery Computes
v2.0.0 release notes →The hardest part of building a peripheral vision simulator is explaining what it does. The pipeline — resolution falloff, frequency-selective blur, per-channel color decay, saliency gating — produces output that looks “blurry” to anyone who hasn’t used it. The math is doing something specific at each stage, but the result is smooth and continuous, which makes it hard to point at any one thing and say: this is what your peripheral color processing looks like.
v2.0 adds three modes that make the pipeline visible. Same math, different rendering. Instead of smooth blending, you see discrete geometry — blocks, wedges, wireframes — sized and colored by the same cortical magnification function that drives the research modes.
Minecraft: the pooling you can point at
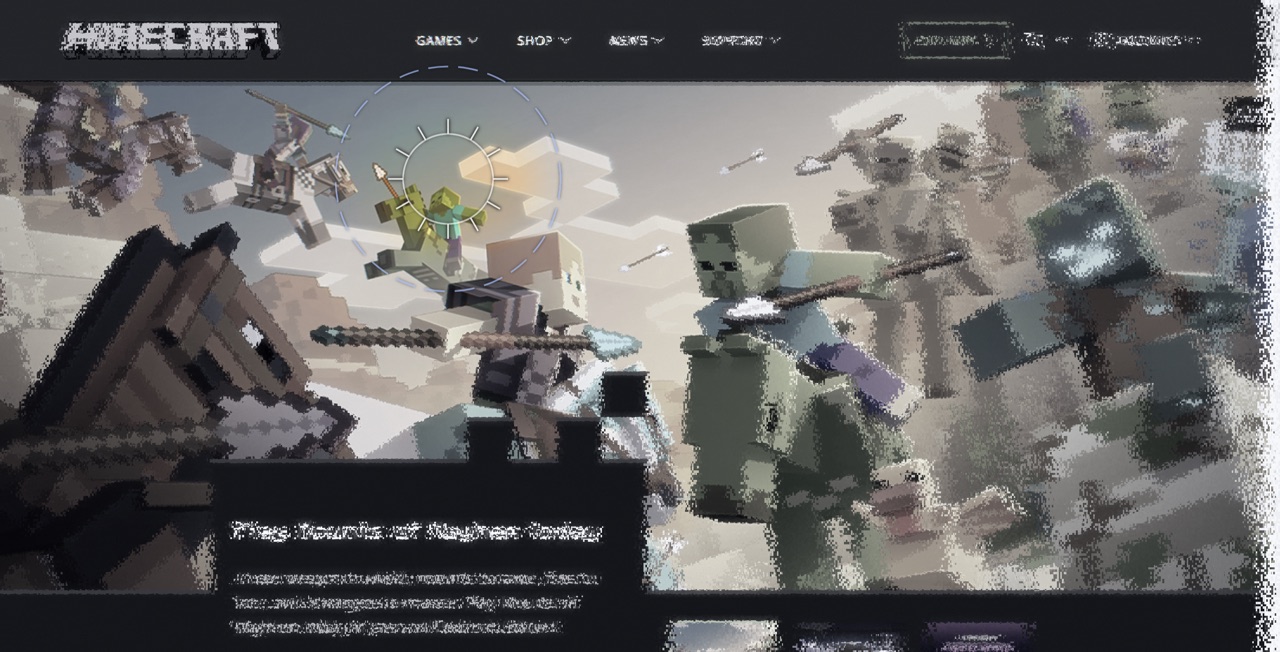
Mode 4 — Minecraft (Block Pooling)
Each block represents one pooling region — the area your brain averages together at that distance from fixation. Near the center: 4px blocks (sharp detail). At the edges: 64px blocks (everything averaged into one color). The grid recomputes around your cursor. You can see the color asymmetry too: red-green boundaries merge between blocks while blue-yellow stays sharper — the same 5:1 decay ratio from Mode 0, made visible.
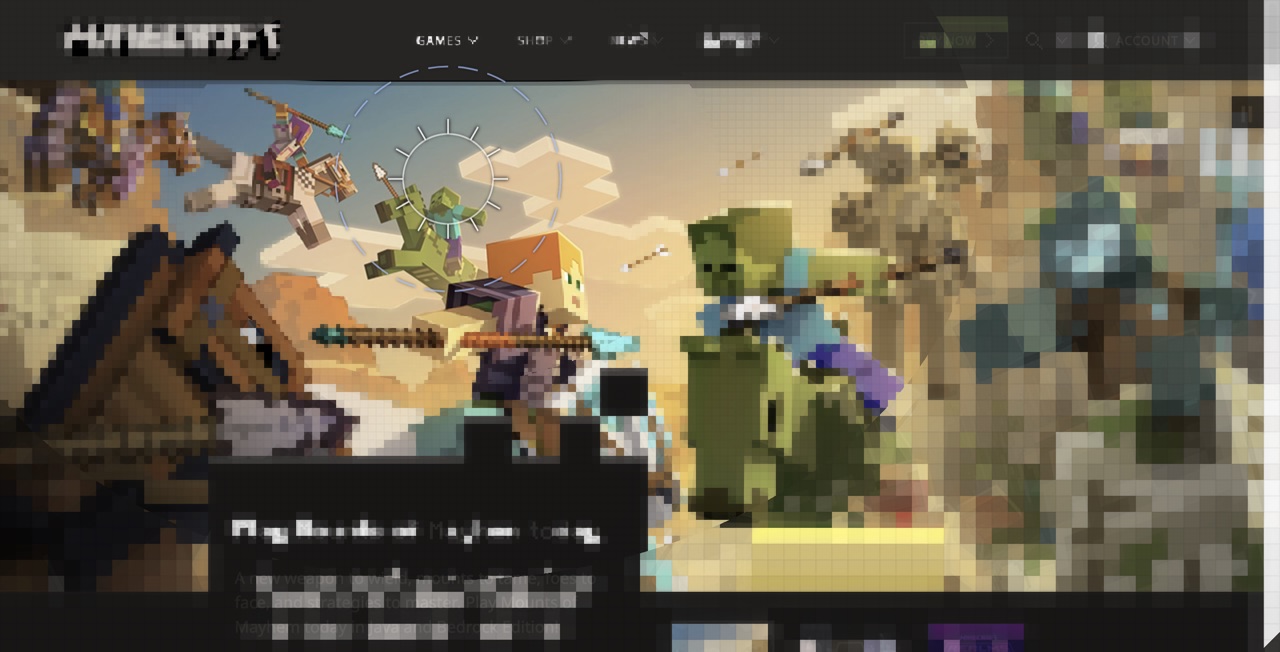
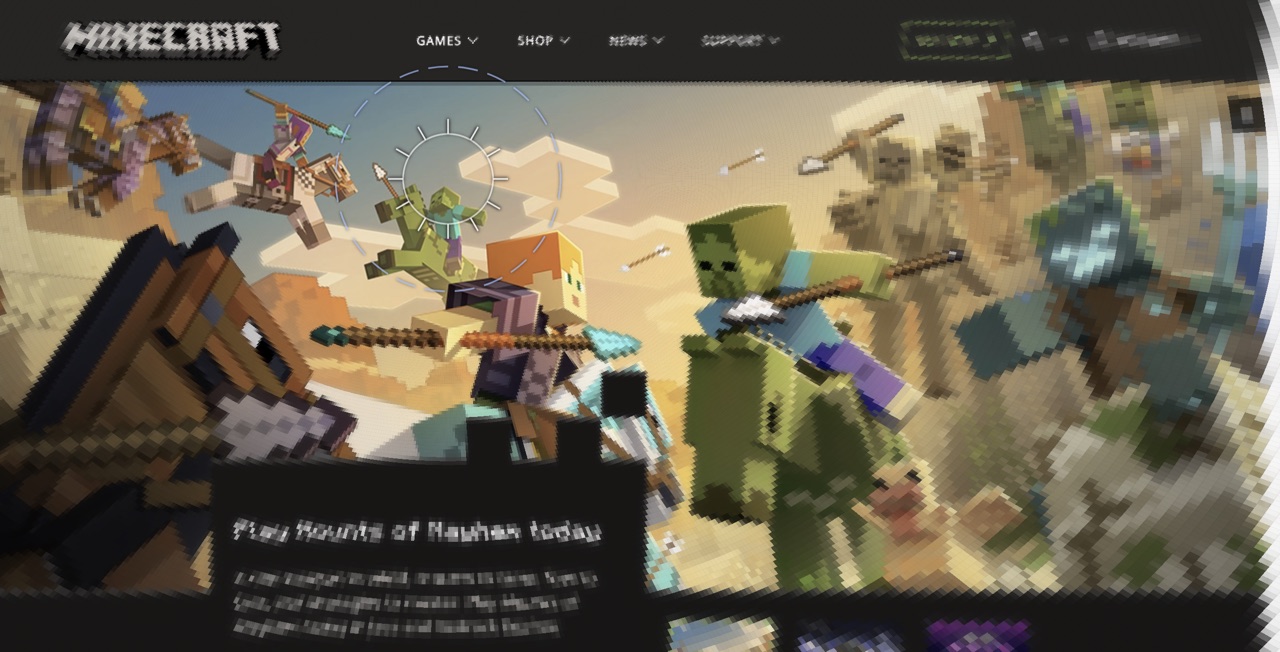
Mode 8 — Minecraft Eyeball (Polar Pooling)
Same math, but in the shape the brain actually uses. Wedge-shaped sectors radiate from your gaze point, growing wider with distance — matching the geometry that Rosenholtz et al. (2012) predict for how peripheral vision pools information. Sectors are elongated about 2:1 along the radial axis, matching crowding measurements.
The block sizes are the MIP levels. The color averaging is the chromatic pooling. When someone asks “what does cortical magnification do?”, you switch to Minecraft and point.
Blueprint: wireframes from the live DOM
Mode 3 — Blueprint (ARIA Wireframe)
The structure map’s alpha channel encodes ARIA role IDs (0–12). The shader maps each role to a color: buttons (green), inputs (amber), headings (cyan), navigation (magenta). The fovea shows original content; the periphery transitions to typed wireframe on a dark blue background. No vision model required — the DOM structure extractor reads semantic HTML and ARIA roles directly. Works on any page that follows web standards.
Density-gated crowding
v1.9 documented a gap: isolated letters and densely flanked letters at the same eccentricity received identical V1 distortion. In real peripheral vision, the isolated letter remains identifiable (Bouma 1970). v2.0 closes this gap with a sigmoid gate on the structure map’s density channel:
crowdingFactor = mix(0.3, 1.0, σ(20 · (density − 0.6)))
Here σ() is the sigmoid function — an S-shaped curve that smoothly transitions from 0 to 1. Dense content (text clusters, UI grids) gets full crowding distortion. Isolated elements are spared down to a 0.3× floor. The threshold (0.6) and steepness (20) were calibrated against the crowding reference page — engineering fits, not psychophysical data. We list this honestly in the paper’s new Open Questions section: whether strength modulation is a reasonable proxy for Bouma’s spacing-based rule is unclear.
Chromatic recalibration
The v1.9 chromatic decay constants came from detection-threshold fits to castleCSF (a contrast sensitivity function model by Ashraf et al. 2024 that predicts how sensitivity varies with spatial frequency, eccentricity, and color channel). Bowers, Gegenfurtner & Goettker (2025) measured suprathreshold chromatic sensitivity — how colors actually look at intensities well above the bare detection threshold, not what you can barely detect. The updated constants:
- RG decay: 0.059 → 0.072 (red-green fades slightly faster)
- YV decay: 0.004 → 0.014 (blue-yellow now fades more noticeably)
The ratio narrows from 14.75:1 to 5.14:1. Blue-yellow is no longer “basically immune” to eccentricity — it just falls off slower than red-green.
Also in this release
- Eccentricity scaling uniform —
u_ecc_scaling(default 0.75, Brown et al. 2023) modulates pooling growth rate across all CMF-enabled modes. Researchers can explore how eccentricity scaling affects peripheral appearance without editing the shader. - Toggle Effects (Cmd+E) — Simulation → Behavior → Toggle Effects. Long URLs no longer push the toolbar eye toggle off-screen.
- 10 modes across 4 categories: 4 research, 4 presentation, 1 experimental. The declarative mode registry defines each as a JSON object — zero-code A/B comparisons.
- Arxiv paper synced with shipped features. New Open Questions section: 5 honest gaps in the simulation.
What’s next
Next: orientation-dependent blur (horizontal/vertical edges persist further than diagonal ones Shipped in v2.2), improved far-periphery color accuracy, and better crowding models. The crowding stage is the biggest open question — current GPU rendering may not be able to fully capture how nearby elements interfere with each other in peripheral vision. The Open Questions section in the paper enumerates what we don’t know.
References cited: Bouma 1970 · Bowers, Gegenfurtner & Goettker 2025 · Brown et al. 2023 · Rosenholtz et al. 2012 (TTM) · Blauch, Alvarez & Konkle 2026 (FOVI) — Annotated Bibliography · Primer References