2026-03-16
Peripheral Color: From Cliff to Gradient
Foveated renderers tend to desaturate the periphery too aggressively. The assumption is intuitive — acuity drops, so color must too — but the biology says otherwise. All three cone classes persist across the retina. L and M cones tile the periphery at lower density; S-cones were never dense to begin with, so their relative drop is modest. Psychophysical measurement puts blue-yellow sensitivity at 15° at ~79% of foveal, red-green at ~29% (Bowers et al. 2025). The periphery is not colorblind. It sees color at lower spatial resolution.
Scrutinizer’s previous color pipeline missed this. A single
smoothstep ramp compressed the entire transition into one degree:
full color at the fovea, gray by 2°. A red banner and red body text at the same
eccentricity got identical treatment. Both wrong.
| Original | 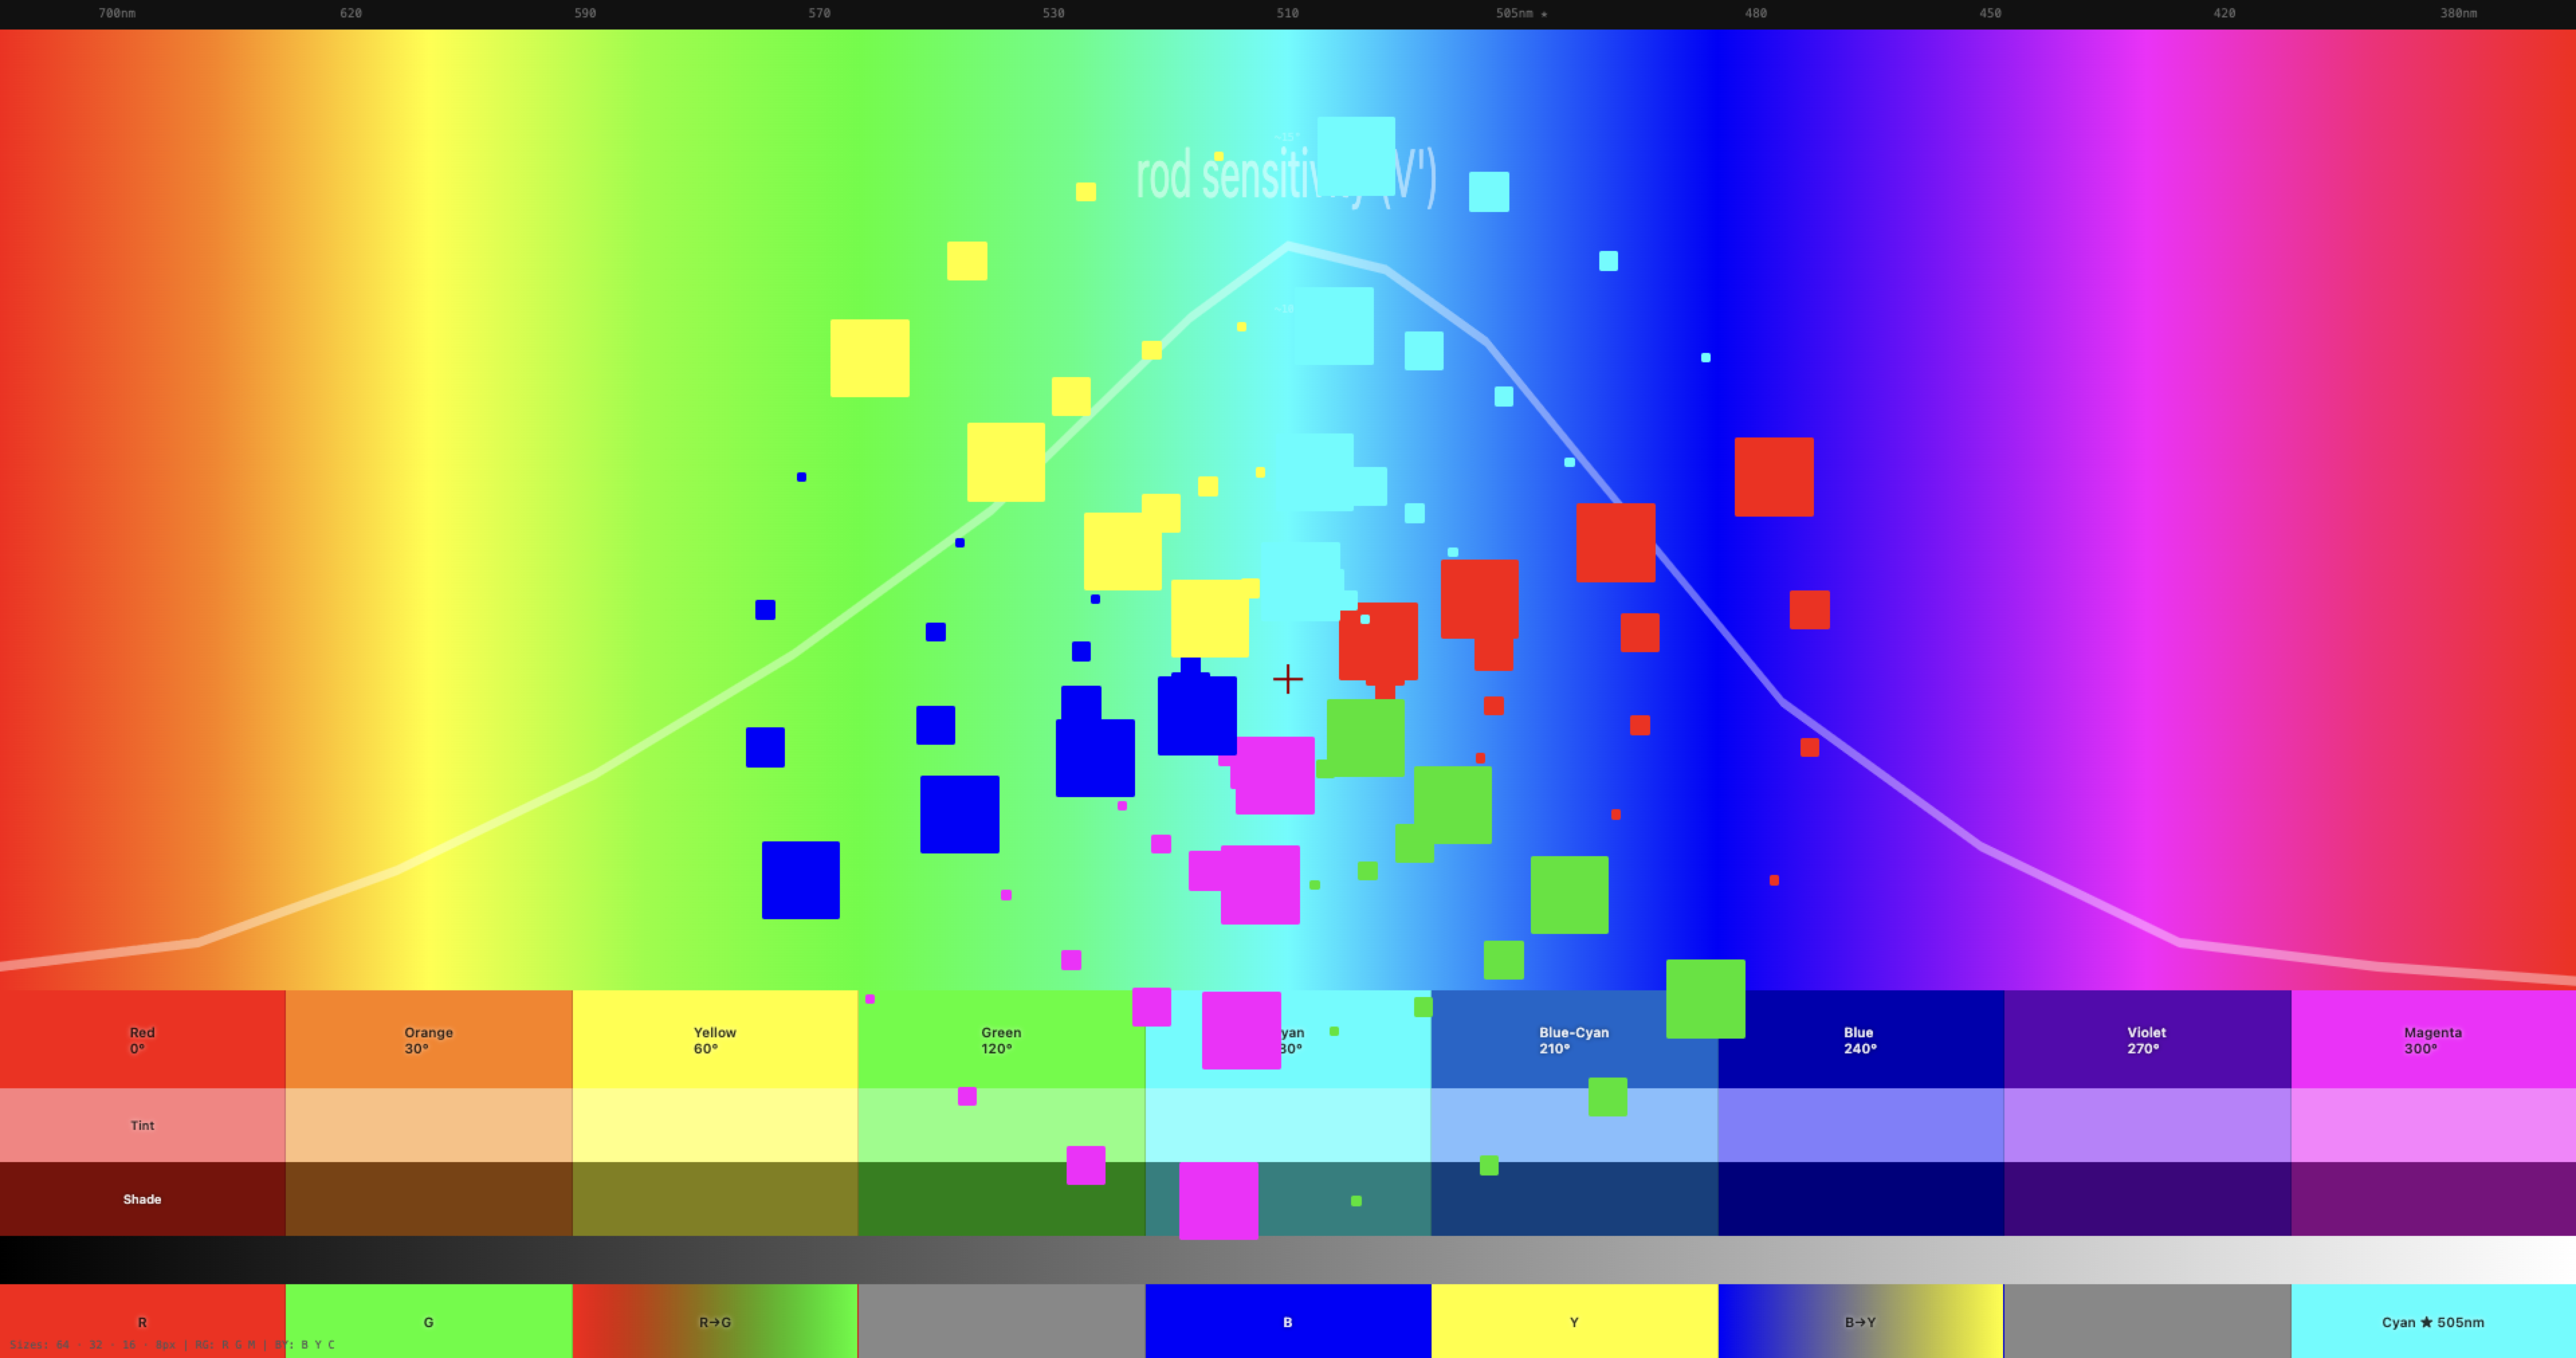 |
| Before | 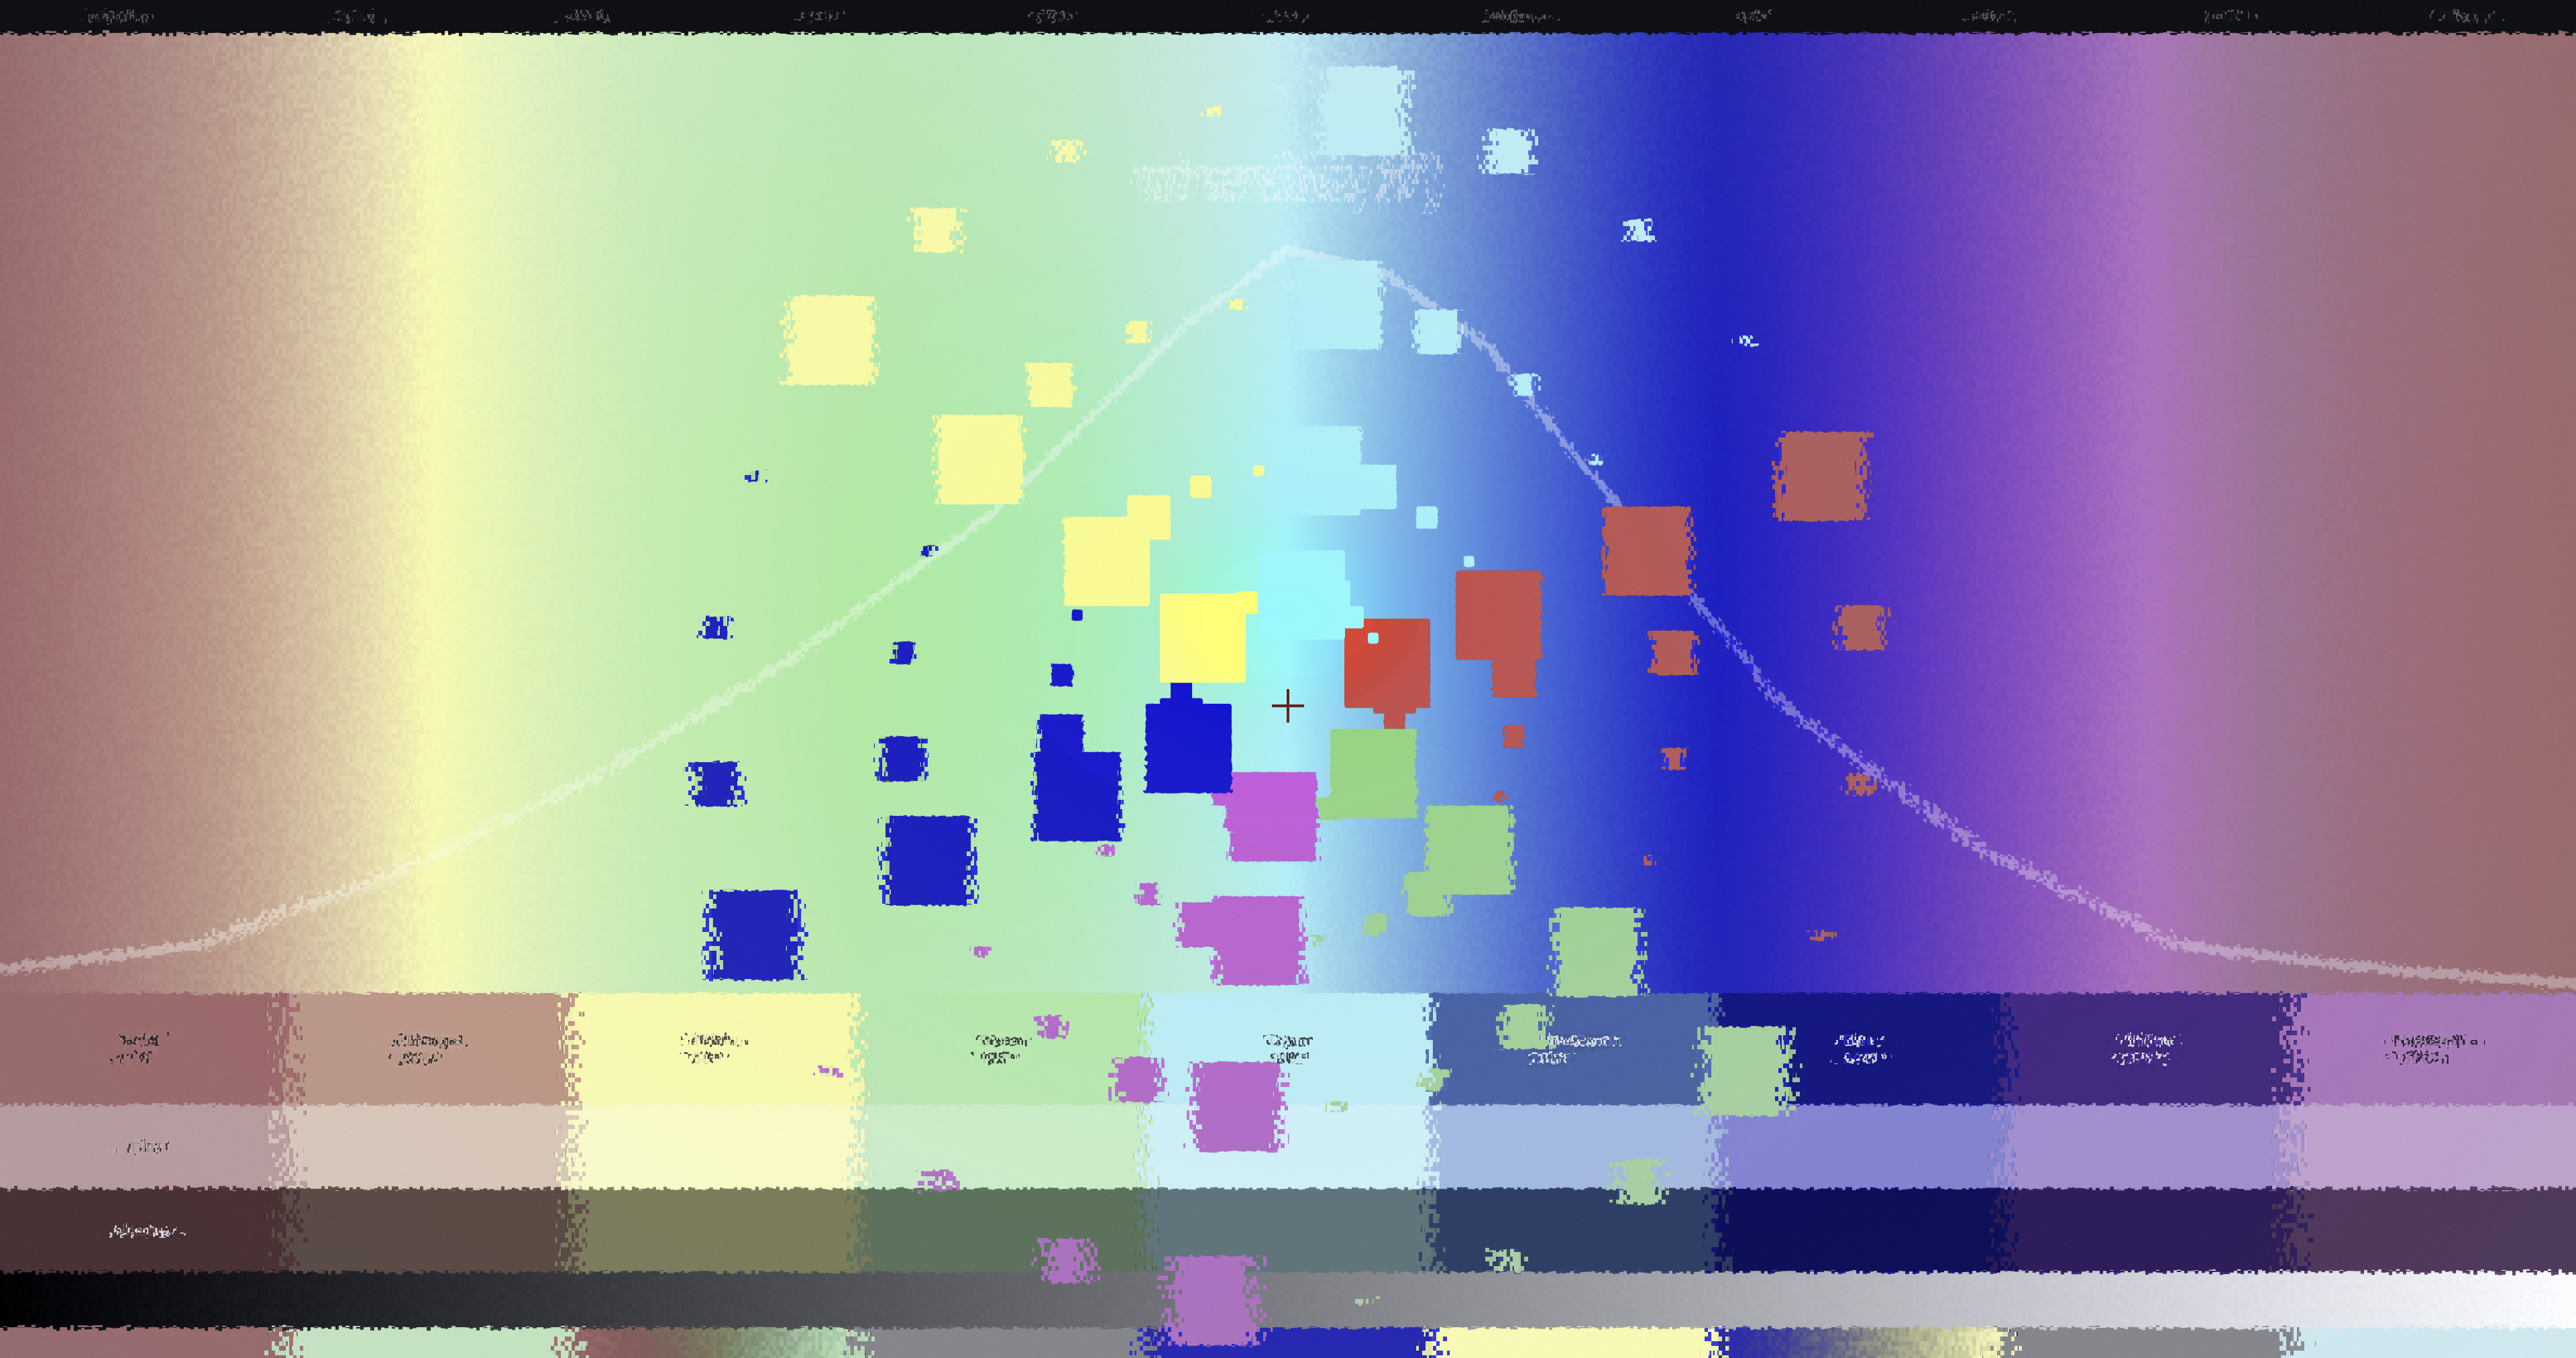 |
| After | 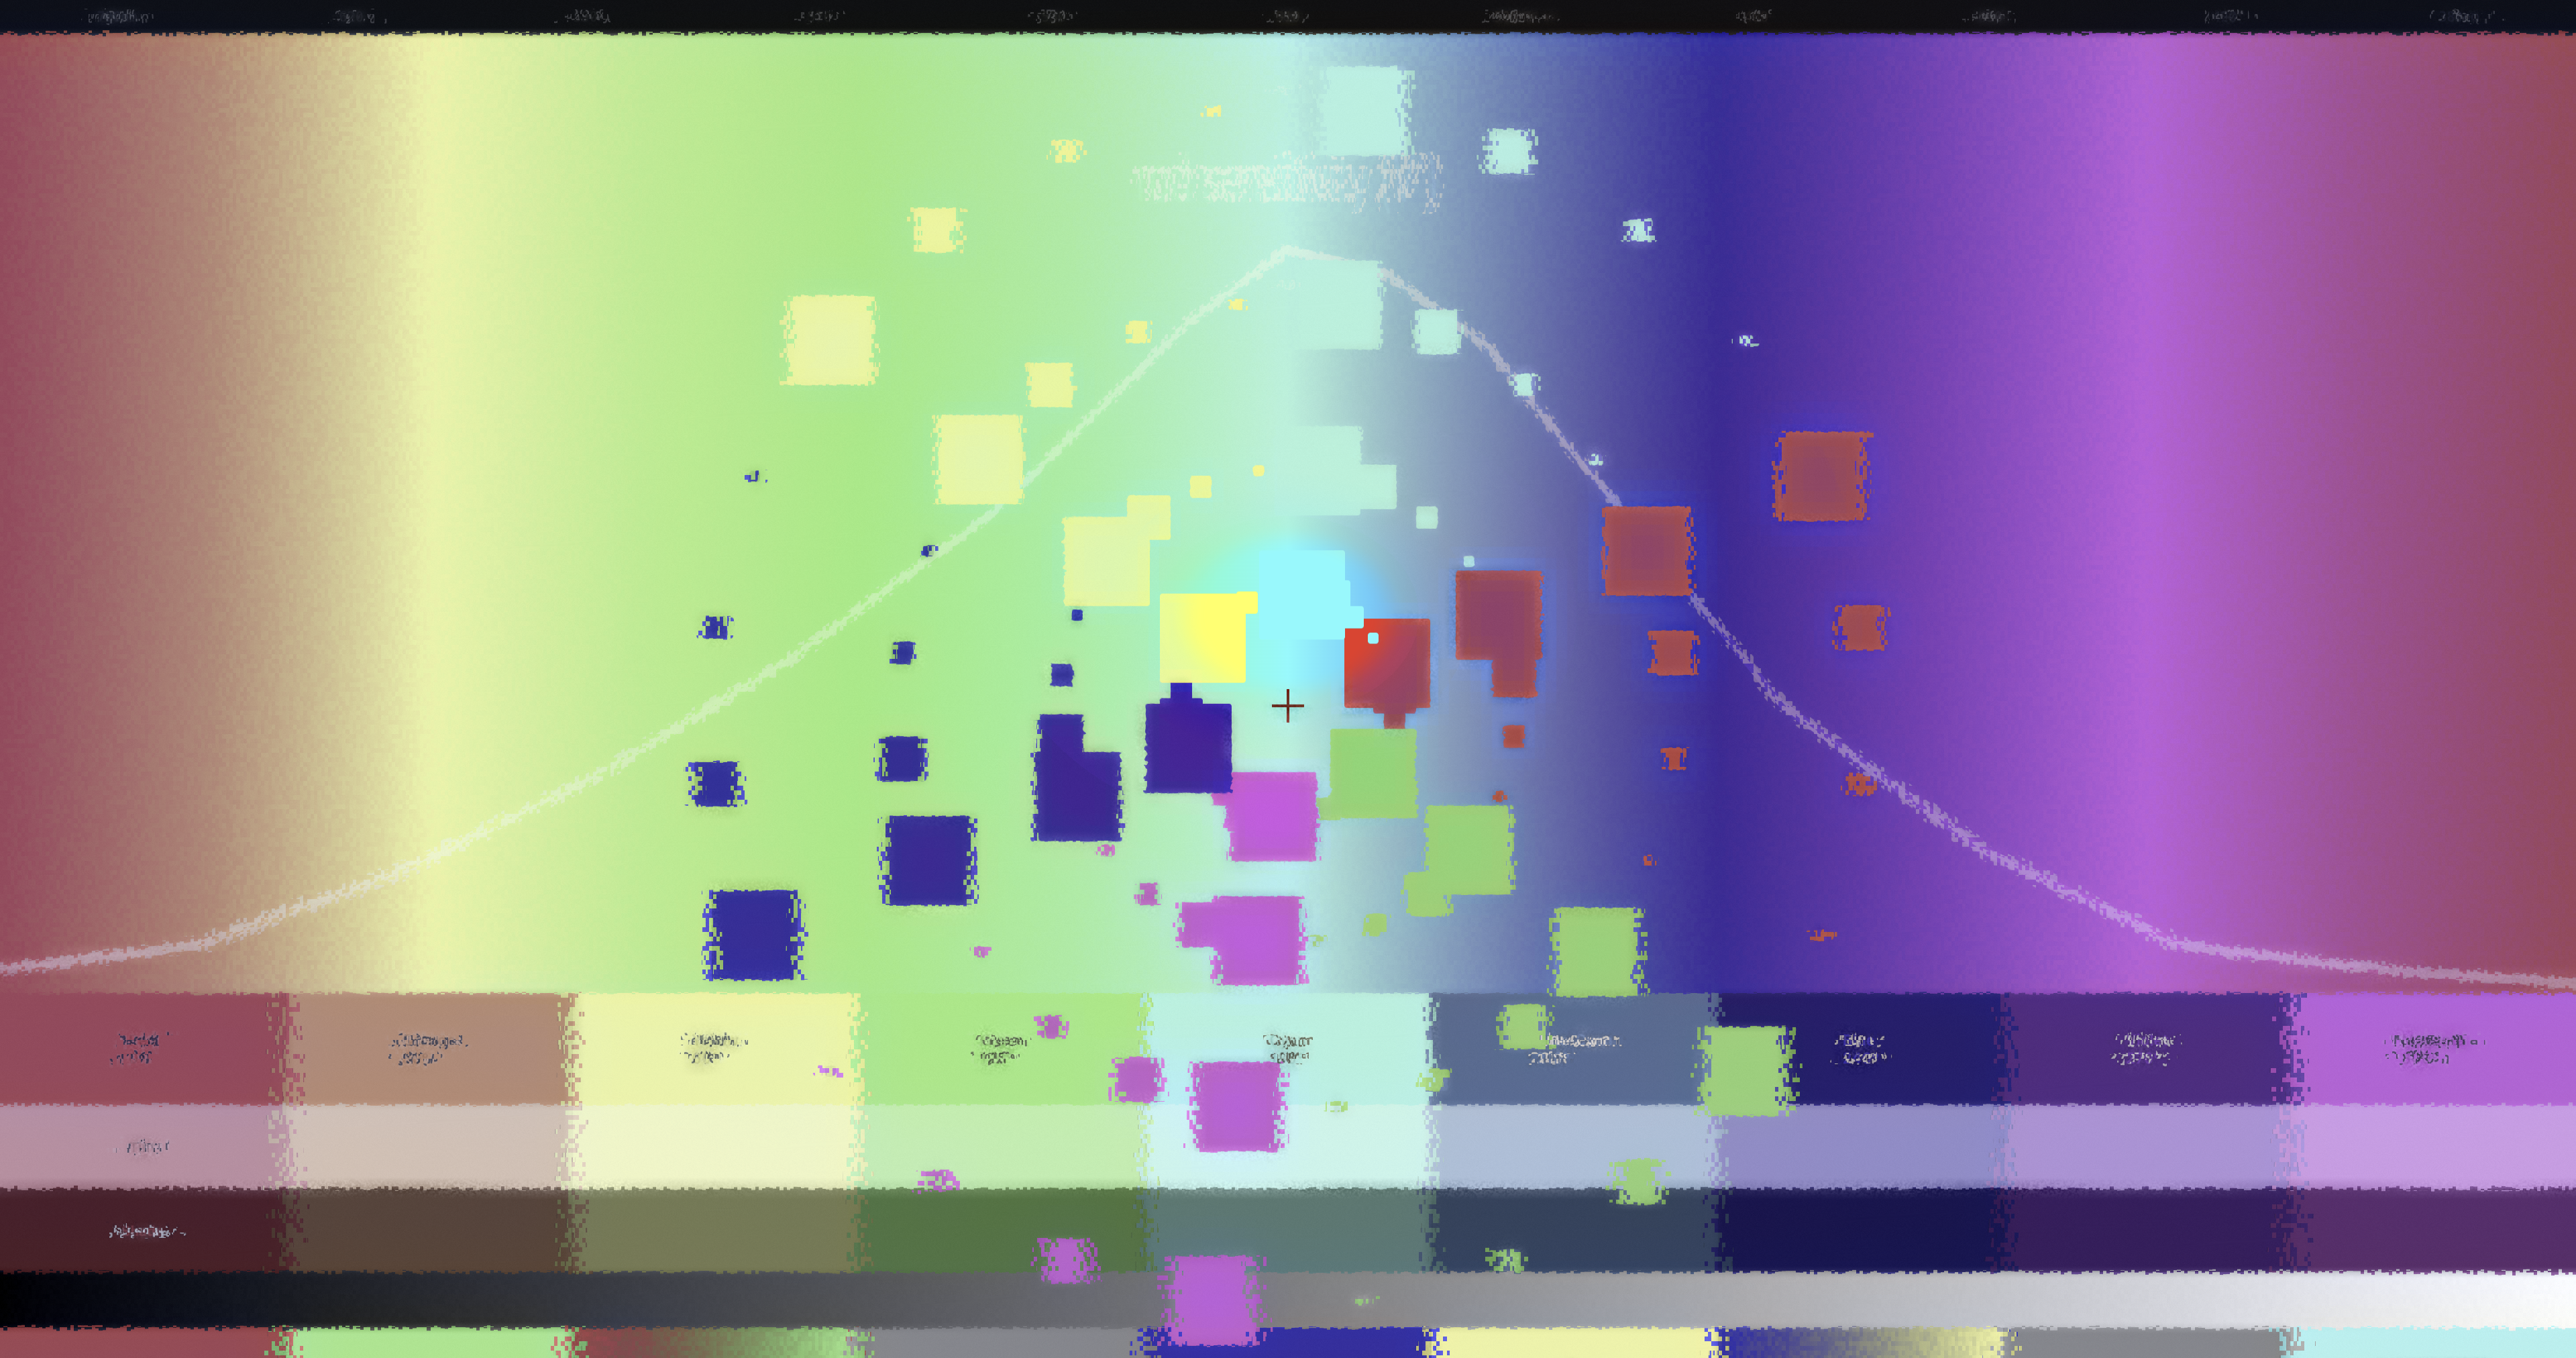 |
Original: unfoveated. Before: color dies at 2°. After: gradient rolloff, blue-yellow survives further than red-green.
What changed
Wider frequency coverage. The Difference-of-Gaussians decomposition extended from 8 bands (down to 0.35 cpd) to 12 bands (down to 0.088 cpd). The old range covered text and icons. The new range covers panel backgrounds, banners, and page-level color — exactly the scales where peripheral color perception is strongest, because S-cone signals pool spatially over large areas.
Swatch-aware preservation. The coarsest MIP level
(mip[12], averaging ~64×64 source pixels) provides a free
swatch signal. Its Oklab chrominance magnitude distinguishes large uniform color
regions from mixed content. Swatches retain up to 30% more color than text at the
same eccentricity.
Gradual ramp. The base desaturation ramp widened from 1°–2° to 1°–6°. The per-band CSF attenuation handles frequency-specific rolloff. The ramp’s job is a spatial envelope, not a cliff.
Calibrated RG decay. The red-green channel decay rate
(rg_decay) increased from 0.072 to 0.085. At 12.4° (ring 5), the
model’s BY/RG ratio is 1.86×, monotonically separating from 1.05×
at 2.5°. The single-exponential decay cannot fully capture the biphasic RG
falloff that
Bowers et al. (2025) measured
(steep to ~15°, then slowing), but the rank ordering and channel separation
are correct across the measured range.
Validation
24px colored dots at five eccentricity rings (2.5°–12.4°), ~0.94 cpd at 45 ppd, measured through the pipeline:
| Color | 2.5° | 7.5° | 12.4° |
|---|---|---|---|
| Red | 82.5% | 57.8% | 39.4% |
| Green | 85.5% | 65.2% | 49.6% |
| Blue | 94.6% | 84.8% | 73.5% |
| Yellow | 94.2% | 83.9% | 72.5% |
Tier 1 — must pass 9/9
All four colors decrease monotonically. BY retention ≥ 1.5× RG at
12.4° (1.86×). Both model predictions and rendered screenshots pass.
Tier 2 — should pass 2/3
BY/RG channel ratio at 12.4°: model 2.59 vs
Bowers 2.72 at 15°
(5% off, threshold 20%). Green tracks red more than blue (10pp vs 24pp gap).
Both pass. The miss: rendered pixel values match the analytical model within
15% for only 5/20 measurements. The MIP chain and base desaturation ramp
introduce quantization the model doesn’t predict. Rank ordering is
correct; absolute values diverge.
Tier 3 — stretch 3/3
Model retention correlates with
Hansen et al. (2009) color naming
accuracy at r = 1.000. BY outranks RG at every eccentricity ring (20/20).