2026-03
Measuring What Your Eyes Can’t Ignore
Running Rosenholtz’s Feature Congestion on live web pages — in the desktop app, from the command line, or via MCP.
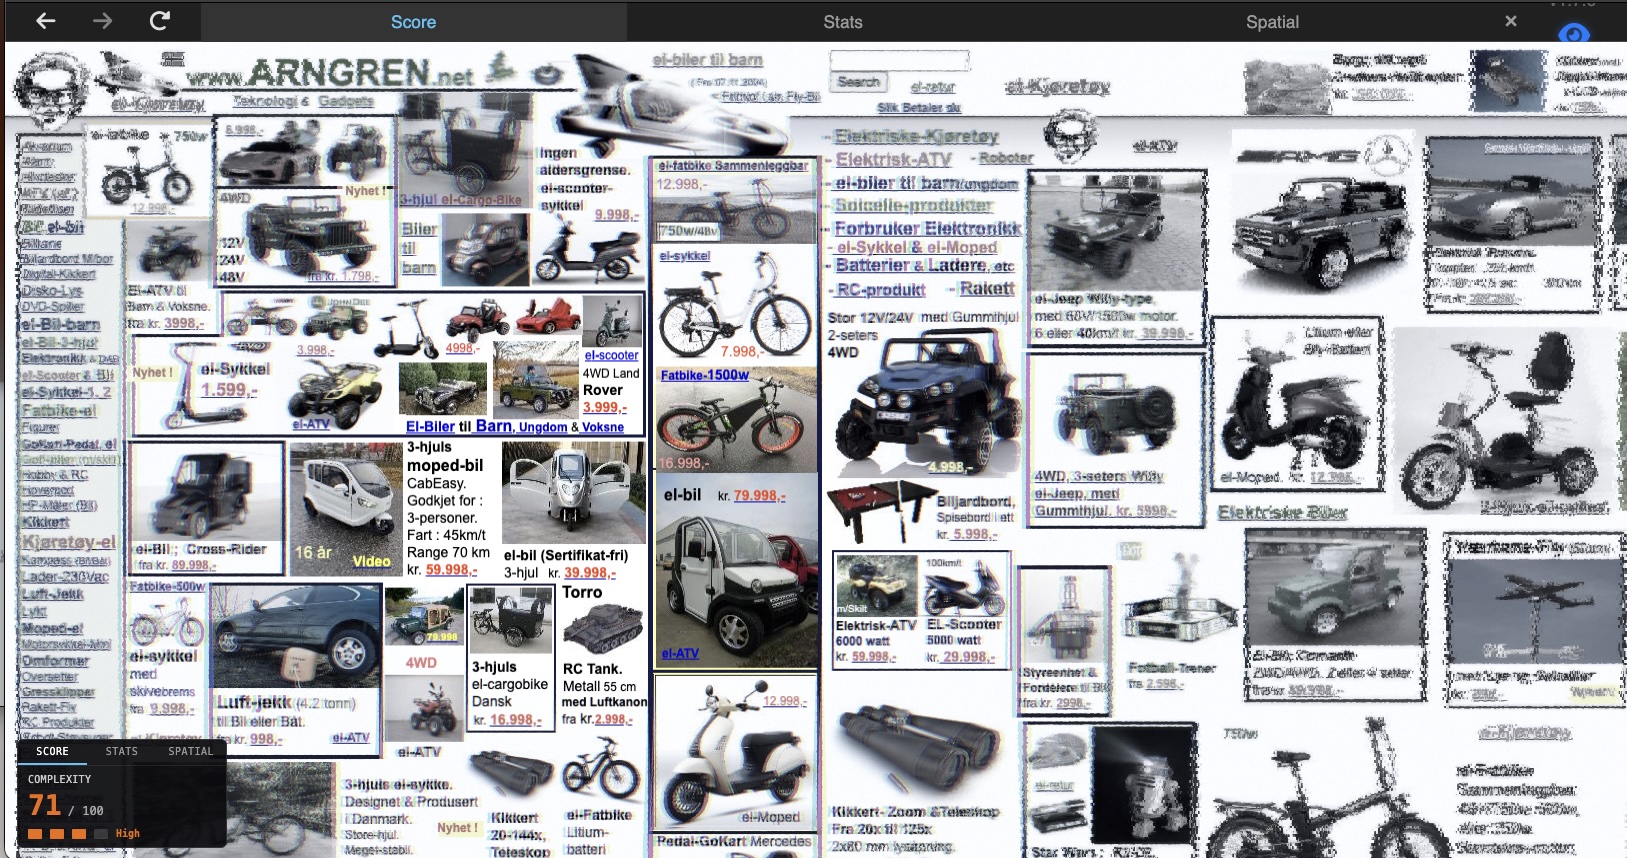
A score of 71 out of 100. That’s what Feature Congestion gives arngren.net — the internet’s poster child for visual chaos. Dozens of product images, mixed font sizes, competing colors, text overlapping images, no grid, no hierarchy. Your eyes don’t know where to land.
Your visual system already knew that. Before you read a single word, your brain’s pre-attentive channels were already overwhelmed. The complexity readout in Scrutinizer is an implementation of Rosenholtz et al.’s Feature Congestion measure (2007) — an attempt to put a number on that feeling of “this is too much.”
What Feature Congestion Measures
Feature Congestion was developed by Ruth Rosenholtz, Yuanzhen Li, and Lisa Nakano at MIT (2007, Journal of Vision). The core insight: visual clutter isn’t about how much stuff is on the page — it’s about how much the stuff varies locally.
A page full of evenly-spaced, same-sized, same-colored items isn’t cluttered. A page where every neighboring element is a different size, color, and orientation is. Feature Congestion captures this by measuring the local variance of low-level visual features across three channels:
- Lightness (L) — brightness variation
- Red-green (|a|) — color variation along the red-green opponent axis
- Blue-yellow (|b|) — color variation along the blue-yellow opponent axis
These L, a, b channels come from Oklab — a perceptually uniform color space where equal numerical distances correspond to equal perceived color differences.
Where all three channels have high local variance simultaneously, that’s congestion — multiple visual features competing for attention in the same patch of screen.
The score is the 90th percentile of congestion across the page, square-root scaled to spread across 0–100. P90 answers: “how cluttered are the busy parts of this page?” — ignoring the whitespace margins that would drag a mean score down.
Congestion vs. Saliency
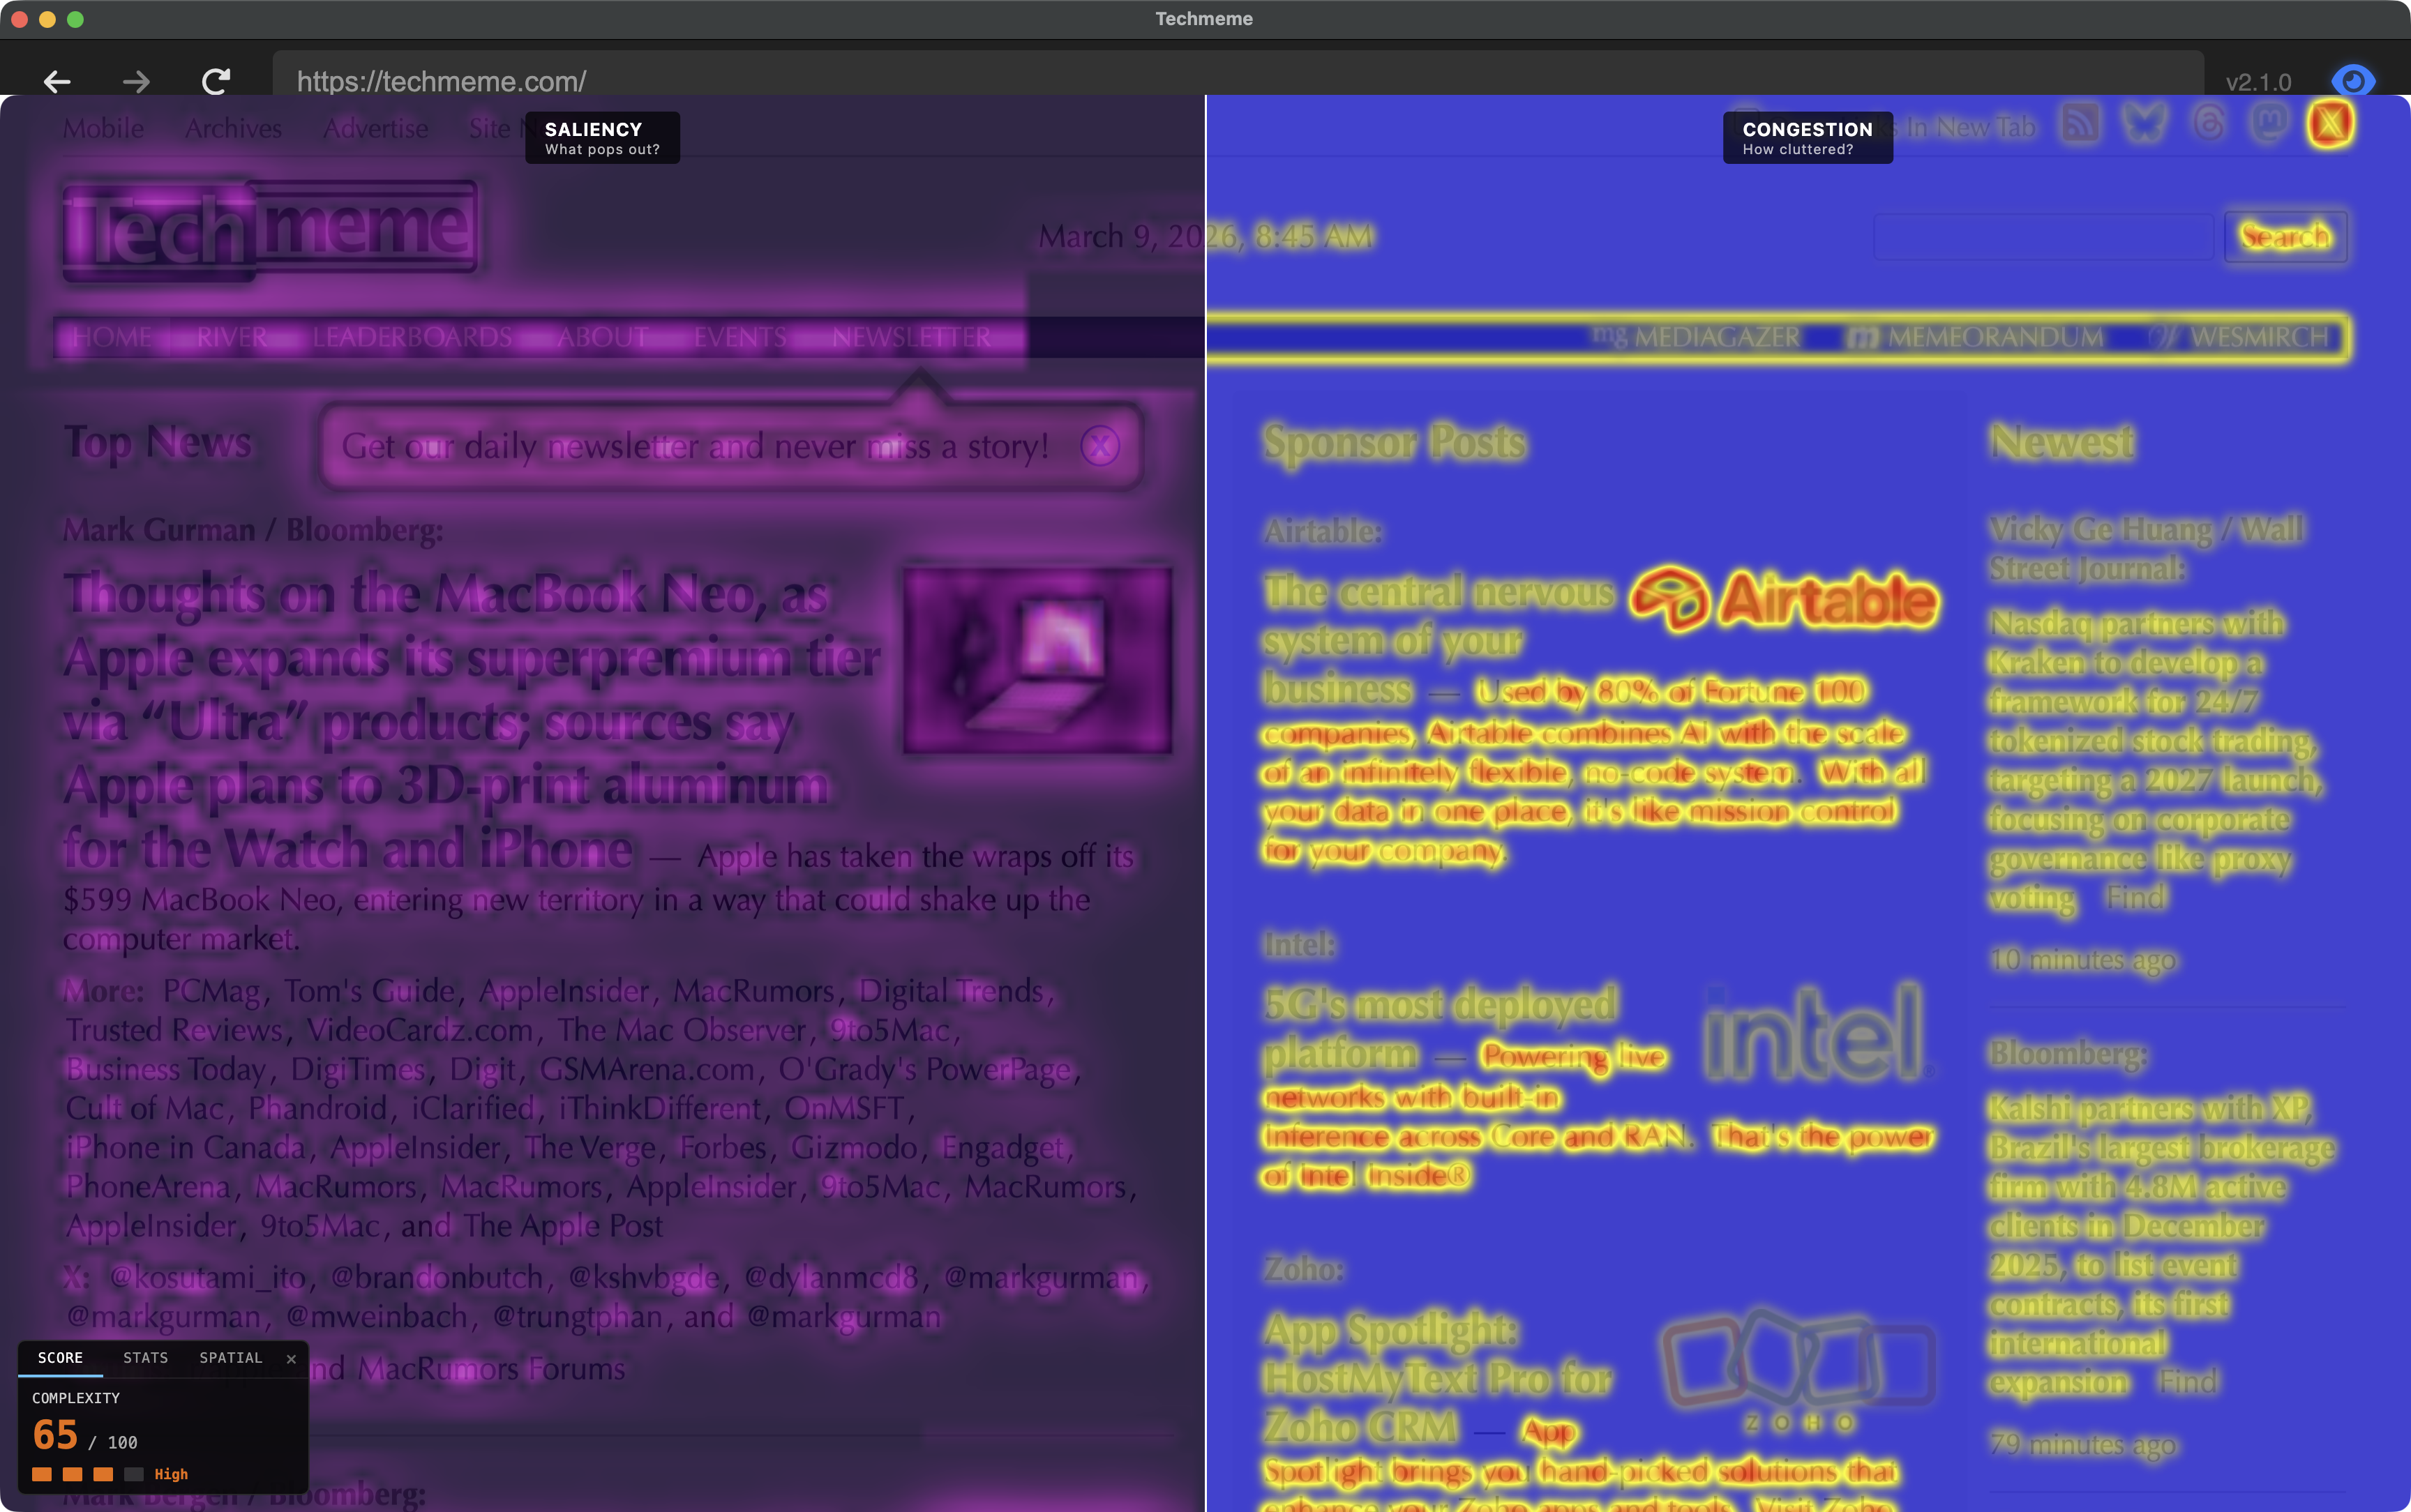
Scrutinizer computes two separate heatmaps — both from established vision science — that look superficially similar but answer different questions.
Saliency: “What pops out?”
The saliency map uses center-surround contrast (Difference-of-Gaussians, inspired by Itti, Koch & Niebur 1998). It detects things that are different from their local context. A single red button on a gray page is highly salient. Saliency is relative — the same red button on a red page would score low.
Congestion: “How much is going on here?”
The congestion map measures local feature variance (Rosenholtz et al. 2007). It doesn’t care about contrast with surroundings — it cares about how much variation exists within each local neighborhood. A dense grid of different-colored products is highly congested even though no single item particularly pops out. Congestion is absolute.
The revealing case: a page with a clean hero section and a dense product grid below the fold. The saliency map lights up the hero headline (it contrasts with the clean background). The congestion map lights up the product grid (high variance in color, size, and text density within every neighborhood). Same page, different questions, different answers.
As of v1.9, the desktop app includes a split-screen comparison mode (Simulation → Utility → Congestion Report → Saliency vs Congestion) that renders both maps simultaneously — saliency in a cool indigo–to–white palette on the left, congestion in the blue–yellow–red heatmap on the right. Seeing them side by side on the same page makes the distinction immediate.
Under the Hood
Scrutinizer runs two separate analysis passes: saliency (“what pops out?”) runs continuously to drive the peripheral simulation, and congestion (“how cluttered?”) runs on demand when you open the ComplexityHUD. Both analyze the page image in Oklab color space, which measures color differences the way humans perceive them.
The score blends color/luminance variation (70%) with edge density (30%), using the 90th percentile — measuring the busy parts of the page, not the whitespace margins. Validated at Spearman ρ=0.93 (a rank-order correlation — 1.0 means perfect agreement in how pages are ordered from least to most cluttered) against the Rosenholtz reference implementation (details in the v1.8 release notes and the congestion journey doc).
Why Scrutinizer’s scores match the research
The original Feature Congestion algorithm was designed for photographs, where the “right” neighborhood size scales with image resolution. Web pages are different — a 512 px capture and a 1024 px capture are the same layout at different pixel densities. Text is still text. Buttons are still buttons. Scaling the analysis window with resolution blurs these features together, and the scores stop making sense.
Scrutinizer uses a fixed analysis window (σ=2.5 pixels, where σ is the standard deviation of the Gaussian kernel that defines the neighborhood size) matched to the feature scale that matters on web pages — roughly the size of a text character. This gives consistent rankings across capture resolutions, validated at ρ=0.93 against the reference implementation. The full validation pipeline is documented in the congestion journey doc.
What the Ratings Mean
| Score | Rating | What it looks like |
|---|---|---|
| 0–25 | Low | Apple product hero pages, single-focus layouts |
| 26–50 | Medium | Blog posts, documentation pages, clean e-commerce |
| 51–75 | High | News aggregators, dense product grids, data dashboards |
| 76–100 | Extreme | arngren.net territory — multiple competing visual systems |
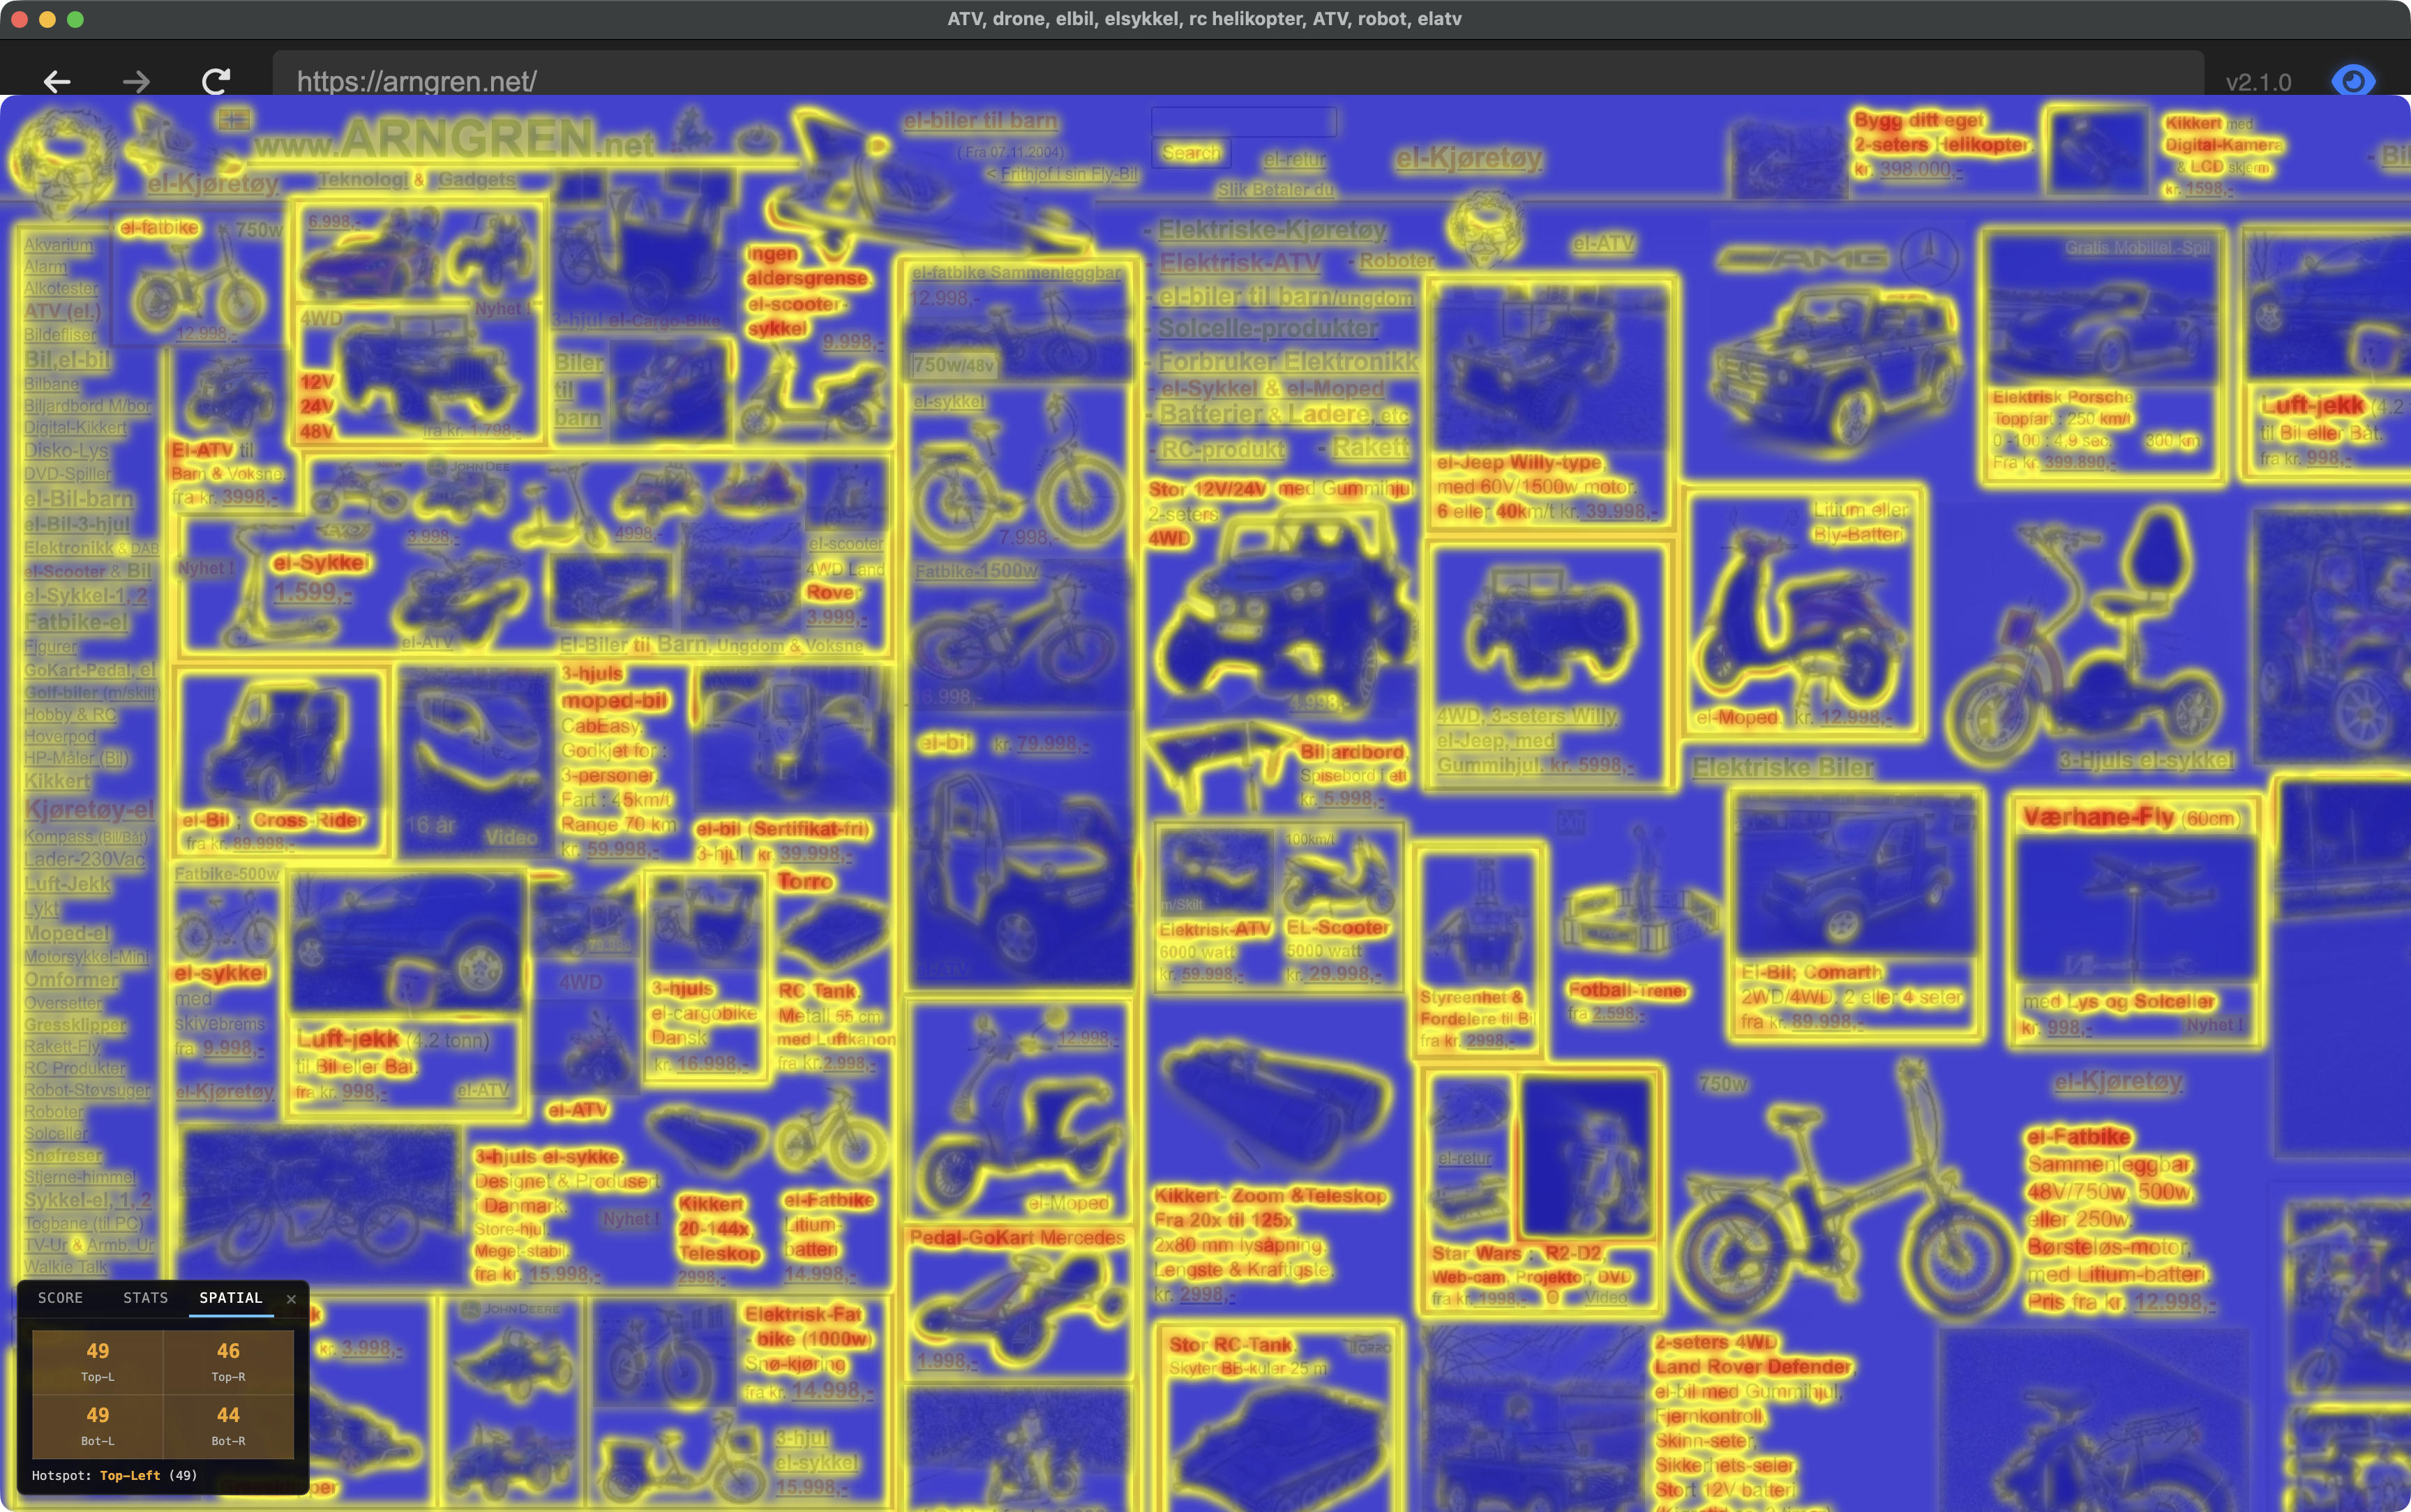
The spatial breakdown (Spatial tab in the HUD) shows which quadrant of the viewport is hottest — useful for identifying whether clutter is concentrated in a sidebar, header, or distributed evenly.
CLI & MCP: Scoring Without the GUI
The desktop app is for exploration — moving your mouse, watching the peripheral simulation, toggling the heatmap. But if you want to score pages at scale, or integrate congestion into a CI pipeline, Scrutinizer ships two headless interfaces that run the same analysis engine.
scrutinizer-audit — Command-Line Interface
A headless CLI that crawls pages with Playwright, captures screenshots, and runs Feature Congestion analysis. Lighthouse for visual clutter.
# Single pagescrutinizer-audit https://example.com# Multiple pages, both viewportsscrutinizer-audit https://apple.com https://amazon.com --viewport desktop,mobile# CI gate: fail if any page exceeds score 50scrutinizer-audit --sitemap https://example.com/sitemap.xml --fail-above 50 --json# Before/after comparisonscrutinizer-audit https://example.com --output before.jsonscrutinizer-audit https://example.com --output after.jsonscrutinizer-audit --compare before.json after.json
The CLI supports sitemap parsing (--sitemap), URL lists from files
(--file), heatmap PNG export (--heatmaps), configurable
analysis resolution (--max-dim), scroll positions (--scroll
above-fold,first-scroll), and HTML/JSON report output.
MCP Server — AI Agent Integration
For AI-assisted design review, Scrutinizer exposes its analysis as an MCP (Model Context Protocol) server. Claude Code — or any MCP-compatible agent — can call congestion analysis directly during a conversation.
# Register with Claude Codeclaude mcp add scrutinizer-audit -- node cli/mcp/server.js
Three tools are exposed:
analyze_url— score a single page (returns score, rating, congestion/edge stats)analyze_urls— batch analysis with aggregate summary (avg, min, max)compare_pages— side-by-side delta between two URLs
Each tool launches headless Chromium, captures the page at the requested viewport, and runs the same σ=2.5 congestion pipeline. The agent can reason about the scores — “the product grid scores 62, try removing the sidebar ads and re-measure” — without the user leaving the conversation.
Both CLI and MCP share the same analysis core: lib/analyzer.js reads a PNG
buffer, computes Oklab channel variance with fixed σ=2.5, and returns the same
congestion/edge density statistics as the desktop app’s ComplexityHUD.
Scores in the Wild
To ground the rating scale, here are scores from scrutinizer-audit run against
live pages. Desktop viewport (1440 × 900), above-fold capture, σ=2.5.
| Page | Score | Rating | Cong p90 | Edge p90 |
|---|---|---|---|---|
| example.com (near-empty page) | 0 | Low | 0.000 | 0.000 |
| wikipedia.org | 31 | Medium | 0.084 | 0.116 |
| persci.mit.edu/gallery | 38 | Medium | 0.173 | 0.070 |
| apple.com | 46 | Medium | 0.262 | 0.082 |
| persci.mit.edu | 53 | High | 0.252 | 0.359 |
| persci.mit.edu/people/rosenholtz | 53 | High | 0.274 | 0.305 |
| arngren.net | ~71 | High | — | — |
Rosenholtz’s own page at MIT’s Perceptual Science Group scores 53 — High. Older academic sites tend to land here: dense text, heterogeneous formatting, small images mixed with body copy. The gallery page fares better (38) because image grids, despite being visually busy, have more uniform local neighborhoods than text-heavy layouts.
The floor is 0 (example.com is a near-empty IANA placeholder). The practical range for real sites runs from the low 20s up to arngren.net territory at 71. Most production sites cluster in 30–55.
Why This Matters
Visual clutter has measurable effects on task performance. Rosenholtz’s 2007 paper showed that Feature Congestion predicts visual search time: the higher the congestion, the longer it takes to find a target. For web pages, that translates directly to: can your users find what they’re looking for?
UX practitioners already knew this empirically. NNGroup’s eye-tracking research found that users don’t read web pages — they scan in an F-shaped pattern, sweeping the top, then progressively less of each subsequent line (Pernice 2017, building on Nielsen’s 2006 eye-tracking studies). The F-pattern is what happens when scanning works — when enough visual structure exists that the eye can sample efficiently and move on. Feature Congestion quantifies when it fails: when local feature variation is so high that no region stands out, the efficient scan breaks down into effortful search. The F collapses into thrashing.
In information foraging terms (Pirolli & Card 1999), congestion measures where information scent degrades at the pre-attentive level. Users follow scent — visual cues that signal relevant content — but scent requires peripheral sampling to work. When congestion is high, the peripheral summary statistics that support rapid scanning become noisy, and the user needs more fixations to extract the same navigational signal.
The complexity readout gives you a number you can track as you iterate on a design. Did that layout change reduce clutter? By how much? In which region of the page? You can explore visually in the desktop app, gate deployments with the CLI, or let an AI agent measure and suggest improvements through MCP — all running the same σ=2.5 pipeline underneath.
Update (v2.2): Congestion measurement now feeds back into the
rendering pipeline. The congestion heatmap drives a shader uniform
(u_congestion_pooling) that increases V1 crowding distortion in
high-clutter regions — dense text gets stronger peripheral pooling than
clean layouts at the same eccentricity. This closed the loop from measurement
to modulation: congestion doesn’t just report clutter, it shapes how the
peripheral simulation responds to it. Shipped as the default in all research modes
with zero measurable frame-time cost. See the
v2.2 release notes.
References: Rosenholtz, Li & Nakano (2007), “Measuring Visual Clutter”, Journal of Vision. Original MATLAB implementation on MIT DSpace. Scrutinizer implements a simplified version validated at Spearman ρ=0.93 (rank-order correlation) against the reference. — Pernice, K. (2017), “F-Shaped Pattern of Reading on the Web: Misunderstood, But Still Relevant (Even on Mobile)”, Nielsen Norman Group.
Links: v1.8 release notes · GitHub · Congestion journey (implementation log) · scrutinizer-audit CLI · MCP server · Model Context Protocol